Wednesday, August 7, 2019

Implement intra-group cross-row calculation In Birt

【Source】

https://forums.opentext.com/forums/discussion/61542/compare-current-row-with-previous-row-value#latest


【Problem】

I am new to developing reports in BIRT. can someone help me in determining how to obtain previous row value. I want to compare current row value with previous row value. There are three columns in my report. I have grouped the data on first column and the detail rows has first, second and third column. It is the second column on which I want to compare current row with previous row value. Lets call the second column as Shifttime and it's a date time data type attribute


Thanks I did that, but it returned some random values (It did not return previous row values but random values from the dataset). I have used a group by on one of the columns and have sorting applied on that column in ascending manner. Did that cause this to return random results. The expression I used in the computed column is below: (Day is my base column for which I want previous values to return, it's a integer data type). Appreciate your response!
Prevval (computed column) has following expression:

【Answer】

In Birt, to realize cross-row computation within a group, it is usually implemented by SQL window function or report script, but the code is complex. In this case, SPL can be used to assist the reporting tool. Here's an example.               
In this example, there are three fields, of which SELLERID is a grouping field, DAY is a field that needs to be compared, and the field type is date-time type. We need to design a grouping table. SELLERID is a grouping field. Detailed fields are DAY, AMOUNT and calculation column SHIFTTIME. The difference between the current DAY and the Day in the previous record within the group is stored in SHIFTTIME. The source data are as follows:


Use esProc to arrange the data:

A B
1 =connect("db").query("select   SELLERID, DAY,AMOUNT,0 as SHIFTTIME    from SALES order by SELLERID, DAY") //Query the database, create an additional column of   constants for backup.
2 =A1.group(SELLERID).run(~.run(interval(DAY[-1],DAY):SHIFTTIME)) //Grouping by SELLERID and modifying the computed   column SHIFTTIME in each group of data
3 =A2.union() //Merge each group of data
4 return   A1 //Return the calculation results to the reporting   tool

Save the above SPL code as sales.dfx, and then introduce it into the Birt report. For Birt calling SPL please refer to 《How to Call an SPL Script in BIRT
  
Step 1: Add esProc JDBC data source.


Step 2: Create data set. Edit query text.


Step 3: Create a report. The report is designed as follows:


Step 4: WEB preview. The preview result is as follows:


Monday, July 29, 2019

set report parameters with .csv files as datasource

【Source】

https://forums.opentext.com/forums/discussion/50068/set-report-parameters-with-csv-files-as-datasource#latest

【Problem】

our datasource is multiple csv files. we want to set the report parameters to this. How can we do that.

using query birt provides the option of wild cards and linking of report parameters to dataset parameters. But when .csv files are our datasource there is no option of sql query. In such cases , how can we set the report parameters.

【Answer】

SQL query in birt can specify dataset parameters. When dataset parameters are used, they can also be linked to a report parameter, which is simple and easy to operate. Of course, if you want to query data files of CSV type, it is also very convenient, but the dataset of CSV type does not support the specified dataset parameters. If you want to achieve filtering, you can only use the dataset filtering function, and there are some limitations when you use it. Therefore, here we recommend a useful tool - esProc, which is easy to operate and learn, can both filter and transmit parameters, and there are many benefits.

Let's take Birt reporting tool as an example to introduce the implementation process:

In this example, employee sales information is stored in sale. csv, and employee information with dates greater than 2015-03-02 needs to be queried based on input parameters.
  
sale.csv data are as follows:


Here we take accessing local CSV files as an example to show how to use parameters for CSV datasets in birt.
  
The integration of BIRT with esProc is not introduced here. Please refer to《How to Call an SPL Script in BIRT》.
  
Step 1: Add an esProc JDBC data source


Step 2: Add the dataset and write the SQL query CSV file directly.
Query text:

  
Report parameter:
  undefined

Set dataset parameters and link them to report parameters:


Step 3: Create report
The report is designed as follows:

  
Step 4: WEB preview, input parameters, preview results:
(1)input parameter:Date 2015-03-02


Wednesday, June 19, 2019

Dynamic Grouping of crosstab in BIRT

Source:
https://forums.opentext.com/forums/discussion/173783/dynamic-grouping-of-crosstab-in-birt#latest

In business filling-in, sometimes it is necessary to make dynamic grouping of crosstab statistics based on time interval, and realize dynamic grouping by day, week, month and year according to the length of time interval. For example, according to business needs, an enterprise needs to achieve order statistics in a period of time according to two parameters (start date, end date). The statistical rules are as follows:

Example: Calculate the difference between dates based on the input parameter values.
  Var diff = end date - start date                 ----- days apart
  If(diff <15)
     Grouping “date group” to display dates
  If(diff>15)
     Grouping “date group” to display weeks
  If(diff >30)
     Grouping “date group” to display months
  If(diff>365)
     Grouping “date group” to display years

Are the little buddies a little overwhelmed? The above problem is essentially a problem of data preparation, but the way of code in SQL or scripted data sources is hard to write and heavy workload; the way of hiding columns in reports is neither universal nor straightforward. A better solution, then, is to introduce esProc into the reporting tool, which will make it easy to solve all kinds of problems. Next, we will take Birt Reporting Tool as an example to introduce the implementation process. For other reporting tools, they are similar.

In this case, according to the input parameters, the total number of orders, freight charges and order amounts of enterprises from 2012-07-04 to 2014-05-06 are counted. The original data in the table "ORDERS" is as follows:


Let's look directly at esProc's SPL code to solve this problem:

A B C
1 =connect("demo") // Connect the database
2 =A1.query("select   ORDERID,ORDERDATE,FREIGHT,ORDERAMOUNT from ORDERS where ORDERDATE >=? and   ORDERDATE <=? ",startDate,endDate) //Query the order data   between the start date and the end date from ORDERS table. StartDate and   endDate are the date parameters.
3 =interval(startDate,endDate) // Calculate the number of days   between the start and end dates.
4 if A3>365 // If the interval of days is   greater than 365 days, the groups are grouped by year.
5
=startDate|A3.(elapse@y(startDate,~)) // Calculate the grouping table   by year
6
=A2.group(B5.pseg(ORDERDATE);~.count(ORDERID):TotalOrder,round(~.sum(FREIGHT),2):TotalFreight,round(~.sum(ORDERAMOUNT),2):TotalOrderAmount,B5(#):BeginDate) // Group A2 according to B5   interval, and count the total number of orders, freight charges and order   amount, keep two decimal numbers, and B5 as the last column.
7
=B6.new(BeginDate:BeginDate,#2:TotalOrder,#3:TotalFreight,#4:TotalOrderAmount) // Take out the required   data columns and generate a new result table.
8
>A1.close() //Close the database
9
return B7 // Return the result set   grouped by year
10 else if A3>30 // If the interval between days   is greater than 30 days and less than or equal to 365 days, the groups are   grouped by month.
11
=startDate|A3.(elapse@m(startDate,~)) // Calculate the monthly   grouping table
12
=A2.group(B11.pseg(ORDERDATE);~.count(ORDERID):TotalOrder,round(~.sum(FREIGHT),2):TotalFreight,round(~.sum(ORDERAMOUNT),2):TotalOrderAmount,B11(#):BeginDate) // Group A2 according to B11   interval, and count the total number of orders, freight charges and order   amount, keep two decimal numbers, and B11 as the last column.
13
=B12.new(BeginDate:BeginDate,#2:TotalOrder,#3:TotalFreight,#4:TotalOrderAmount)
14
>A1.close()
15
return B13 // Return the result set   grouped by month
16 else if A3>15 // If the interval between days   is greater than 15 days and less than or equal to 30 days, the groups are   grouped by week.
17
=startDate|A3.(elapse(startDate,7*~)) // Calculate the weekly   grouping table
18
=A2.group(B17.pseg(ORDERDATE);~.count(ORDERID):TotalOrder,round(~.sum(FREIGHT),2):TotalFreight,round(~.sum(ORDERAMOUNT),2):TotalOrderAmount,B17(#):BeginDate) // Group A2 according to B17   interval, and count the total number of orders, freight charges and order   amount, keep two decimal numbers, and B17 as the last column.
19
=B18.new(BeginDate:BeginDate,#2:TotalOrder,#3:TotalFreight,#4:TotalOrderAmount)
20
>A1.close()
21
return B19 // Return the result set   grouped by week
22 else // If the interval between days   is less than 15 days, the groups are grouped by date.
23
=startDate|A3.(elapse(startDate,~)) // Calculate the grouping table   by date
24
=A2.group(B23.pseg(ORDERDATE);~.count(ORDERID):TotalOrder,round(~.sum(FREIGHT),2):TotalFreight,round(~.sum(ORDERAMOUNT),2):TotalOrderAmount,B23(#):BeginDate) // Group A2 according to B23   interval, and count the total number of orders, freight charges and order   amount. Keep two decimal numbers, and take B23 as the last column.
25
=B24.new(BeginDate:BeginDate,#2:TotalOrder,#3:TotalFreight,#4:TotalOrderAmount)
26
>A1.close()
27
return B25 // Return the result set   grouped by date


The esProc SPL code is stored as order.dfx file and then introduced into the Birt report. Please refer to Qian College article  《How to Call an SPL Script in BIRT》for details.

Design a table in BIRT report is as follows:


Report calls esProc in exactly the same way as calling stored procedures. For example, in BIRT's stored procedure dataset, call orders (?,?) can be used to call them.

Next, let's take a look at the results of the WEB preview by entering different parameters:

 (1) Input parameters: start time 2012-07-04, end time 2014-05-06                   The interval days are more than 365, and the groups are displayed according to year.


(2)Input parameters: start time 2012-07-15, end time 2012-12-03                  The interval days are more than 30, and the groups are displayed by month.


(3)Input parameters: start time 2012-07-20, end time 2012-08-15                  The interval days are more than 15, and the groups are displayed by week.


(4)Input parameters: start time 2012-07-04, end time 2012-07-18                 The interval days are less than 15, and the groups are displayed by date.


Tuesday, May 14, 2019

How to Use esProc to Assist Reporting Tools

Both SQL and Birt scripts can handle the group operation. In SQL, usually we can only group a table automatically according to its own filed(s). When the grouping criterion comes from another table, or is an external parameter or a conditional list, SQL has to handle the grouping in a very roundabout way. Some cases even require the dynamic criteria, which needs to be implemented by writing complicated report scripts. For some other cases, where the grouping criterion doesn’t entirely correspond to the source table (or the intervals involved don’t have any intersection), either the grouping result should be complemented or the difference should be excluded from it. Both scenarios are difficult to deal with in SQL or with the report script.
With support of alignment grouping, enumeration grouping, and order-related computations, esProc can easily implement those scenarios of non-equi-grouping. That’s why it is a best choice for preparing data needed for report creation. Birt/Jasper ,the reporting tool regards an esProc script as the stored procedure, passes parameter to it and gets the returned result after execution through JDBC. You can learn more from How to Use esProc to Assist Reporting Tools.
Here are some typical problems involving non-equi-grouping in SQL development and their solutions in esProc.
Simple fixed grouping
The sales table stores ordering records, in which CLIENT column holds the client names and AMOUNT column has ordering amounts. For the report, we need to group the table according to the list of “potential clients” and to aggregate the AMOUNT column in each group. The list is an external parameter and contains some items that the CLIENT column doesn’t (Their aggregation results should be zero). Now suppose the list is TAS,BON,CHO,ZTOZ . Below is a selection of the source data:
OrderID
Client
SellerId
Amount
OrderDate
26
TAS
1
2142.4
2009/8/5
33
DSGC
1
613.2
2009/8/14
84
GC
1
88.5
2009/10/16
133
HU
1
1419.8
2010/12/12
32
JFS
3
468
2009/8/13
39
NR
3
3016
2010/8/21
43
KT
3
2169
2009/8/27
When the grouping criterion is fixed and contains relatively few items, you can have union or decode work with SQL to perform the group. As with this example, the grouping criterion is a dynamic external parameter. We have to create a temporary table, parse each value of the parameter and insert the results into the temporary table before moving on to the subsequent computations. But with esProc, we don’t need to create a temporary table. Here’s the esProc code:
2016-03-09_105320
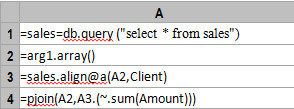
The align function groups records by arg1, the external parameter list, and uses @a option to get all records from each group; without @a, the function will get the first record of each group. The pjoin function composes each record in order, as shown below:
2016-03-09_105331
Dynamic aggregate by intervals
Suppose we want to segment the sales table according to the ordering amounts and aggregate the amounts for each segment in the report. The criterion of segmentation is a list parameter, which includes multiple items, such as four intervals separated by 0-1000, 1000-2000 and 2000-4000.
With a fixed criterion, we can write it directly in the SQL statement. But with a dynamic external parameter, we often need to compose the SQL statement using a report script, a high-level language such as JAVA. The process could be very complicated. esProc, however, supports the dynamic expression to produce smart code:
2016-03-09_105353
byFac is a parameter, like [“?<=1000″ ,”?>1000 && ?<=2000″,”?>2000 && ?<=4000″,”?>4000″]. The enum function groups records according to the criterion. Here’s the result:
2016-03-09_105405
It happens that the above conditional intervals don’t overlap each other. But in practice it’s not uncommon to have overlapped conditions. For instance, suppose we want to group the ordering amounts according to the following rules:
1000 ~ 4000: Regular orders
Below 2000: Common orders
Above 3000: Important orders
Among these conditions, r1 and r2 overlap each other. Sometimes we don’t want duplicate records in the grouping result (that is, after finding records satisfying r1, then find records satisfying r2 from the rest of the records). Other times we do want the duplicate records (find records satisfying each condition from the whole table). For both scenarios, SQL needs a great amount of withunionexcept or minus statements to produce extremely lengthy code. By default, the esProc enum function performs groups without duplicates; but it also allows them by using @r option.
Dynamic accumulation by intervals
The performance table holds the performance scores and performance bonuses of employees. Starting from zero, we divide the performance scores every 10 scores and then, from low to high, aggregate the bonuses cumulatively section by section. That is, the accumulated amount of the current section should cover the bonuses of all previous sections. Below is the source data:
id
score
bonus
e01
9
800
e02
21
2300
e03
25
2800
e04
33
4100
e05
46
5800
e06
52
6099
Since the performance scores are not fixed, the number of intervals is unfixed too. Oracle and MSSQL are able to implement this by creating an auxiliary interval list and using the window functions, but they produce lengthy code. It’s even harder for databases that don’t support window functions, such as MySQL. esProc is a simpler alternative to deal with this type of non-equi-grouping cases. Below is the esProc code:
2016-03-09_105417
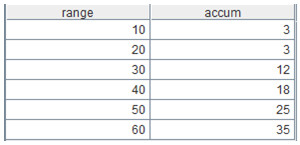
A2 generates intervals dynamically, in which m gets members by their sequence numbers,m(-1) gets the last member and “\” gets the integer part of the quotient. A3 creates a two-dimensional table based on A2 and accumulates bonuses by querying corresponding records in A1. Here’s the result:
2016-03-09_105426
Complementing the source table for fixed grouping
The building table contains records of project completion, in which year is the string type completion time in the format of “year the first half year\the second half year”. For the report, we need to count the number of buildings that have been completed for each type of project during every half year over a period specified by beginning and ending years. Below is the source data:
id
type
year
1
33
2014 last half
2
33
2014 last half
3
33
2013 first half
4
34
2013 first half
The years in the source table are inconsecutive. It’s not easy for SQL to fill in the missing years and then do the left join. We can use esProc to make the job simpler:
2016-03-09_105436
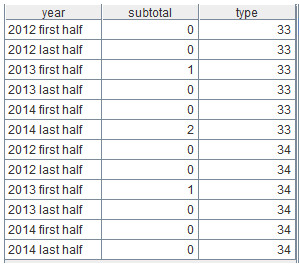
A2 creates a new two-dimensional table. A3 creates a year list according to the beginning and ending parameters (argbarge). A4 groups the building table by type and processes each group by loop. Each loop (B4) will insert into A2 a number of records that are the same with the number of items in the year list. Here’s A2’s final result:
2016-03-09_105444
Complement to the source table for fixed grouping and transposition
The onBusiness table stores the records of the employees’ business trips, in which Dateand id_user are the main fields. The user table holds the user information, whose main fields are id and name. We want to show in the report whether each employee has a business trip plan for each week in order, with a special requirement that each employee has a column. Below is a selection from the onBusiness table:
Date
id_user
2015-06-22
2
2015-06-01
1
2015-06-03
1
2015-06-19
1
2015-06-02
2
Suppose the beginning date and ending date are 2015-05-31 and 2015-06-28, the desired report layout would be like this:
week
user1
user2
1
yes
yes
2
No
No
3
yes
No
4
No
yes
esProc code:

2016-03-09_105520
First query the desired data using a simple join statement. Next create a two-dimensional table A3 by the intervals, where each week has a row (automatically filling in missing values when dates are interrupted) and each employee has a column. The initial values are “No”. Then loop through A2’s groups to modify corresponding values in A3 to “Yes”.
Inter-group calculation by months
The work table stores information for a job. In the table, People field holds names of workers, Date field has the entry dates and Deleted field holds the quitting dates. We need to summarize from March to July how many people are on the job each month in the report. Below is the source data:
People
Date
Deleted
Amanda
2015-03-01
Null
Ray
2015-03-01
Null
Moe
2015-04-01
Null
Yan
2015-05-01
Null
Bee
2015-05-05
2015-06-12
Lee
2015-06-06
Null
Jason
2015-05-01
2015-07-03
The problem here is that the months in the source table may be discontinuous, yet we want a consecutive result. So we need to first generate the consecutive months and then perform the alignment grouping on the source table according to the consecutive months. A worker who quits the job will still be included in the on-the-job list of the current month, but will be excluded from that of the next month. To obtain the right number of the workers who are on the job in each month, we need to perform the inter-column calculation and inter-group accumulation.
esProc code:
2016-03-09_105604
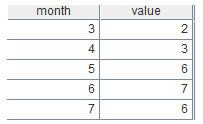
The to function generates a consecutive sequence. The new function creates a two-dimensional table based on a sequence (or another two-dimensional table). ~ represents the current member in the original sequence. Here’s the final result:
2016-03-09_105614
Dynamic locating of an interval
The Transaction table records the time points of each transaction for each user. The Discount table holds the discount information after certain time points. There are multiple discount records, forming dynamic time intervals. Now we need to calculate the discount of each transaction for each user for reporting.
Below is a selection of the Transaction table:
TransID
Tuser
Date
t1
Andrew
2015-06-16 13:13:00
t2
Andrew
2015-06-16 13:15:00
t3
Andrew
2015-06-16 13:17:00
t4
Andrew
2015-06-16 14:15:00
t5
Andrew
2015-06-16 14:18:00
t6
Andrew
2015-06-16 14:25:00
t7
Andrew
2015-06-16 14:35:00
t8
Andrew
2015-06-16 14:55:00
t9
tylor
2015-06-16 13:13:00
t10
tylor
2015-06-16 14:15:00
t11
tylor
2015-06-16 14:55:00
Below is a selection of the Discount table:
DiscountID
Date
Discount
d1
2015-06-16 13:00:00
30
d2
2015-06-16 14:00:00
25
d3
2015-06-16 14:30:00
20
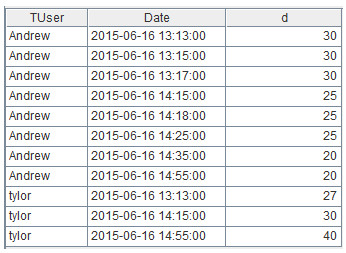
In SQL, we need to first generate the time intervals through inter-row calculation and then perform the join, which is difficult to implement. Whereas in esProc, we can perform the equi-grouping on Transaction according to Discount, meaning the code is simpler:
2016-03-09_105715
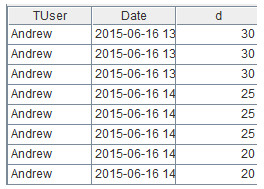
The pseq function calculates the interval number to which a record belongs, and A2(…) gets records by their sequence numbers. Here’s the result:
2016-03-09_105725
In this example all users share the same discount. If each user has its own discount (there is a DUser field in the Discount table), the code should be like this:
2016-03-09_105756
Here’s the result:
2016-03-09_105805