Both SQL and Birt scripts can handle the group operation. In SQL, usually we can only group a table automatically according to its own filed(s). When the grouping criterion comes from another table, or is an external parameter or a conditional list, SQL has to handle the grouping in a very roundabout way. Some cases even require the dynamic criteria, which needs to be implemented by writing complicated report scripts. For some other cases, where the grouping criterion doesn’t entirely correspond to the source table (or the intervals involved don’t have any intersection), either the grouping result should be complemented or the difference should be excluded from it. Both scenarios are difficult to deal with in SQL or with the report script.
With support of alignment grouping, enumeration grouping, and order-related computations, esProc can easily implement those scenarios of non-equi-grouping. That’s why it is a best choice for preparing data needed for report creation. Birt/Jasper ,the reporting tool regards an esProc script as the stored procedure, passes parameter to it and gets the returned result after execution through JDBC. You can learn more from How to Use esProc to Assist Reporting Tools.
Here are some typical problems involving non-equi-grouping in SQL development and their solutions in esProc.
Simple fixed grouping
The sales table stores ordering records, in which CLIENT column holds the client names and AMOUNT column has ordering amounts. For the report, we need to group the table according to the list of “potential clients” and to aggregate the AMOUNT column in each group. The list is an external parameter and contains some items that the CLIENT column doesn’t (Their aggregation results should be zero). Now suppose the list is TAS,BON,CHO,ZTOZ . Below is a selection of the source data:
OrderID
|
Client
|
SellerId
|
Amount
|
OrderDate
|
26
|
TAS
|
1
|
2142.4
|
2009/8/5
|
33
|
DSGC
|
1
|
613.2
|
2009/8/14
|
84
|
GC
|
1
|
88.5
|
2009/10/16
|
133
|
HU
|
1
|
1419.8
|
2010/12/12
|
32
|
JFS
|
3
|
468
|
2009/8/13
|
39
|
NR
|
3
|
3016
|
2010/8/21
|
43
|
KT
|
3
|
2169
|
2009/8/27
|
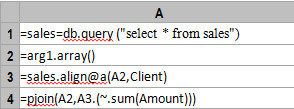
When the grouping criterion is fixed and contains relatively few items, you can have union or decode work with SQL to perform the group. As with this example, the grouping criterion is a dynamic external parameter. We have to create a temporary table, parse each value of the parameter and insert the results into the temporary table before moving on to the subsequent computations. But with esProc, we don’t need to create a temporary table. Here’s the esProc code:
The align function groups records by arg1, the external parameter list, and uses @a option to get all records from each group; without @a, the function will get the first record of each group. The pjoin function composes each record in order, as shown below:
Dynamic aggregate by intervals
Suppose we want to segment the sales table according to the ordering amounts and aggregate the amounts for each segment in the report. The criterion of segmentation is a list parameter, which includes multiple items, such as four intervals separated by 0-1000, 1000-2000 and 2000-4000.
With a fixed criterion, we can write it directly in the SQL statement. But with a dynamic external parameter, we often need to compose the SQL statement using a report script, a high-level language such as JAVA. The process could be very complicated. esProc, however, supports the dynamic expression to produce smart code:
byFac is a parameter, like [“?<=1000″ ,”?>1000 && ?<=2000″,”?>2000 && ?<=4000″,”?>4000″]. The enum function groups records according to the criterion. Here’s the result:
It happens that the above conditional intervals don’t overlap each other. But in practice it’s not uncommon to have overlapped conditions. For instance, suppose we want to group the ordering amounts according to the following rules:
1000 ~ 4000: Regular orders
Below 2000: Common orders
Above 3000: Important orders
Among these conditions, r1 and r2 overlap each other. Sometimes we don’t want duplicate records in the grouping result (that is, after finding records satisfying r1, then find records satisfying r2 from the rest of the records). Other times we do want the duplicate records (find records satisfying each condition from the whole table). For both scenarios, SQL needs a great amount of with, union, except or minus statements to produce extremely lengthy code. By default, the esProc enum function performs groups without duplicates; but it also allows them by using @r option.
Dynamic accumulation by intervals
The performance table holds the performance scores and performance bonuses of employees. Starting from zero, we divide the performance scores every 10 scores and then, from low to high, aggregate the bonuses cumulatively section by section. That is, the accumulated amount of the current section should cover the bonuses of all previous sections. Below is the source data:
id
|
score
|
bonus
|
e01
|
9
|
800
|
e02
|
21
|
2300
|
e03
|
25
|
2800
|
e04
|
33
|
4100
|
e05
|
46
|
5800
|
e06
|
52
|
6099
|
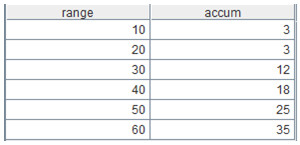
Since the performance scores are not fixed, the number of intervals is unfixed too. Oracle and MSSQL are able to implement this by creating an auxiliary interval list and using the window functions, but they produce lengthy code. It’s even harder for databases that don’t support window functions, such as MySQL. esProc is a simpler alternative to deal with this type of non-equi-grouping cases. Below is the esProc code:
A2 generates intervals dynamically, in which m gets members by their sequence numbers,m(-1) gets the last member and “\” gets the integer part of the quotient. A3 creates a two-dimensional table based on A2 and accumulates bonuses by querying corresponding records in A1. Here’s the result:
Complementing the source table for fixed grouping
The building table contains records of project completion, in which year is the string type completion time in the format of “year the first half year\the second half year”. For the report, we need to count the number of buildings that have been completed for each type of project during every half year over a period specified by beginning and ending years. Below is the source data:
id
|
type
|
year
|
1
|
33
|
2014 last half
|
2
|
33
|
2014 last half
|
3
|
33
|
2013 first half
|
4
|
34
|
2013 first half
|
The years in the source table are inconsecutive. It’s not easy for SQL to fill in the missing years and then do the left join. We can use esProc to make the job simpler:
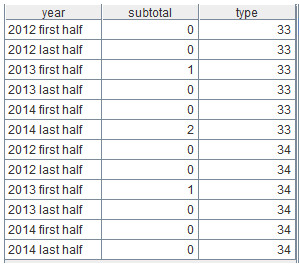
A2 creates a new two-dimensional table. A3 creates a year list according to the beginning and ending parameters (argb, arge). A4 groups the building table by type and processes each group by loop. Each loop (B4) will insert into A2 a number of records that are the same with the number of items in the year list. Here’s A2’s final result:
Complement to the source table for fixed grouping and transposition
The onBusiness table stores the records of the employees’ business trips, in which Dateand id_user are the main fields. The user table holds the user information, whose main fields are id and name. We want to show in the report whether each employee has a business trip plan for each week in order, with a special requirement that each employee has a column. Below is a selection from the onBusiness table:
Date
|
id_user
|
2015-06-22
|
2
|
2015-06-01
|
1
|
2015-06-03
|
1
|
2015-06-19
|
1
|
2015-06-02
|
2
|
Suppose the beginning date and ending date are 2015-05-31 and 2015-06-28, the desired report layout would be like this:
week
|
user1
|
user2
|
1
|
yes
|
yes
|
2
|
No
|
No
|
3
|
yes
|
No
|
4
|
No
|
yes
|
esProc code:
First query the desired data using a simple join statement. Next create a two-dimensional table A3 by the intervals, where each week has a row (automatically filling in missing values when dates are interrupted) and each employee has a column. The initial values are “No”. Then loop through A2’s groups to modify corresponding values in A3 to “Yes”.
Inter-group calculation by months
The work table stores information for a job. In the table, People field holds names of workers, Date field has the entry dates and Deleted field holds the quitting dates. We need to summarize from March to July how many people are on the job each month in the report. Below is the source data:
People
|
Date
|
Deleted
|
Amanda
|
2015-03-01
|
Null
|
Ray
|
2015-03-01
|
Null
|
Moe
|
2015-04-01
|
Null
|
Yan
|
2015-05-01
|
Null
|
Bee
|
2015-05-05
|
2015-06-12
|
Lee
|
2015-06-06
|
Null
|
Jason
|
2015-05-01
|
2015-07-03
|
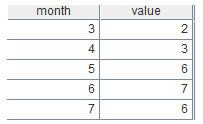
The problem here is that the months in the source table may be discontinuous, yet we want a consecutive result. So we need to first generate the consecutive months and then perform the alignment grouping on the source table according to the consecutive months. A worker who quits the job will still be included in the on-the-job list of the current month, but will be excluded from that of the next month. To obtain the right number of the workers who are on the job in each month, we need to perform the inter-column calculation and inter-group accumulation.
esProc code:
The to function generates a consecutive sequence. The new function creates a two-dimensional table based on a sequence (or another two-dimensional table). ~ represents the current member in the original sequence. Here’s the final result:
Dynamic locating of an interval
The Transaction table records the time points of each transaction for each user. The Discount table holds the discount information after certain time points. There are multiple discount records, forming dynamic time intervals. Now we need to calculate the discount of each transaction for each user for reporting.
Below is a selection of the Transaction table:
TransID
|
Tuser
|
Date
|
t1
|
Andrew
|
2015-06-16 13:13:00
|
t2
|
Andrew
|
2015-06-16 13:15:00
|
t3
|
Andrew
|
2015-06-16 13:17:00
|
t4
|
Andrew
|
2015-06-16 14:15:00
|
t5
|
Andrew
|
2015-06-16 14:18:00
|
t6
|
Andrew
|
2015-06-16 14:25:00
|
t7
|
Andrew
|
2015-06-16 14:35:00
|
t8
|
Andrew
|
2015-06-16 14:55:00
|
t9
|
tylor
|
2015-06-16 13:13:00
|
t10
|
tylor
|
2015-06-16 14:15:00
|
t11
|
tylor
|
2015-06-16 14:55:00
|
Below is a selection of the Discount table:
DiscountID
|
Date
|
Discount
|
d1
|
2015-06-16 13:00:00
|
30
|
d2
|
2015-06-16 14:00:00
|
25
|
d3
|
2015-06-16 14:30:00
|
20
|
In SQL, we need to first generate the time intervals through inter-row calculation and then perform the join, which is difficult to implement. Whereas in esProc, we can perform the equi-grouping on Transaction according to Discount, meaning the code is simpler:
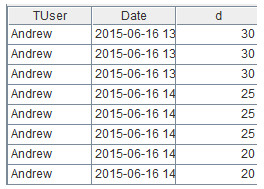
The pseq function calculates the interval number to which a record belongs, and A2(…) gets records by their sequence numbers. Here’s the result:
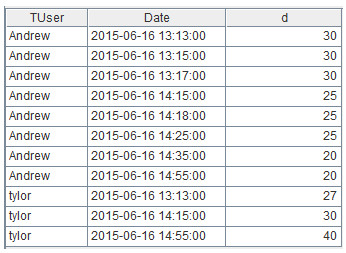
In this example all users share the same discount. If each user has its own discount (there is a DUser field in the Discount table), the code should be like this:
Here’s the result:
